


- Step 1: Understand what a data analyst actually does
- Step 2: Learn spreadsheets first
- Step 3: Learn SQL deeply
- Step 4: Learn data cleaning
- Step 5: Learn basic statistics
- Step 6: Learn data visualization
- Step 7: Build business thinking
- Step 8: Learn Python after SQL and spreadsheets
- Step 10: Build a simple portfolio
- Step 11: Learn how to communicate insights
- Step 12: Prepare your resume the right way
- Step 13: Practice interview questions
- Step 14: Apply strategically
- Step 15: Keep upgrading after you land the role
- Final advice
Data analytics is one of the best entry points into tech.
It has strong demand. It pays well. It does not require years of advanced coding to get started.
But many beginners fail for one reason.
They learn in the wrong order.
They jump between Excel, SQL, Python, Tableau, Power BI, statistics, and random tutorials until everything feels heavy.
You do not need more confusion.
You need a roadmap.
This guide shows you a practical step-by-step path to become a data analyst from zero. If you follow it with consistency, you can build real skills, create a portfolio, and start applying for jobs with confidence.
Step 1: Understand what a data analyst actually does
Before learning tools, understand the job.
A data analyst helps companies make better decisions using data.
That usually means:
- Collecting data
- Cleaning messy data
- Analyzing trends
- Building dashboards
- Answering business questions
- Presenting insights clearly
A data analyst does not just work with numbers.
A good analyst connects data to business outcomes.
For example:
- Why did sales drop last month
- Which marketing channel brings the best customers
- Which product category has the highest profit margin
- Why are users leaving after signup
That mindset matters from day one.
Do not think only about tools. Think about solving problems.
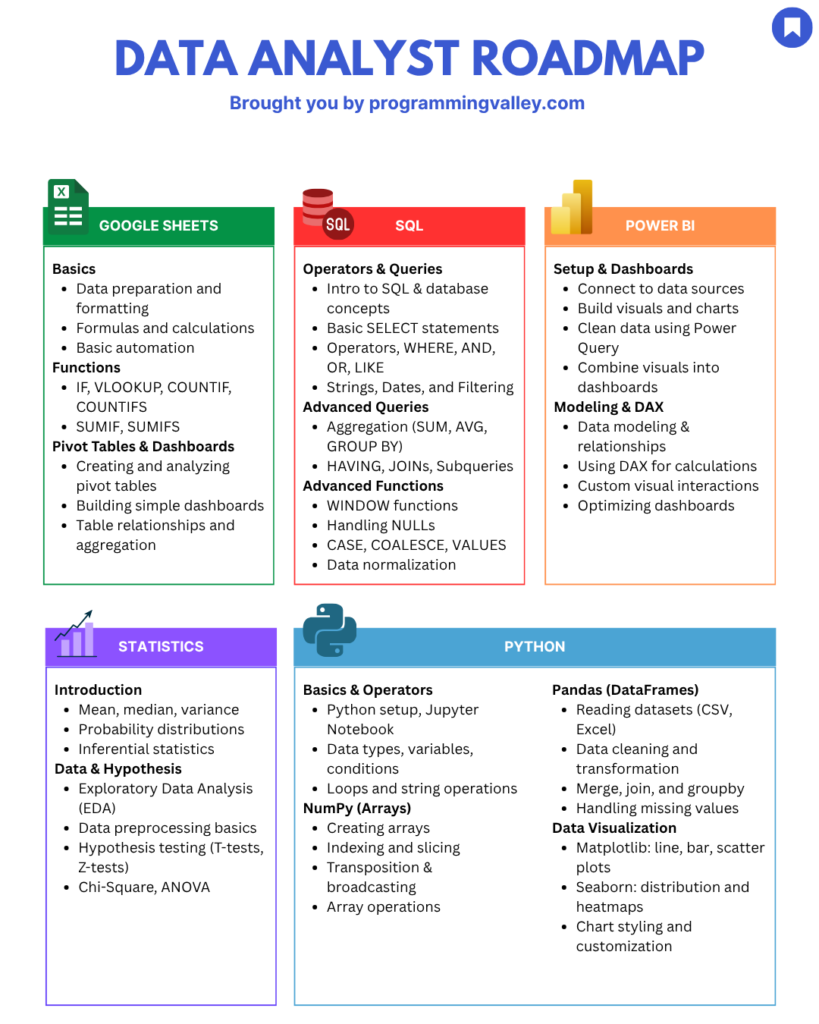
Step 2: Learn spreadsheets first
Start with Excel or Google Sheets.
Some people skip this because it looks basic. That is a mistake.
Spreadsheets are still used in many real analyst roles, especially in business teams, startups, operations, and reporting.
Learn these first:
- Sorting and filtering
- Conditional formatting
- Data cleaning basics
- Text functions
- IF statements
- COUNTIF and SUMIF
- VLOOKUP or XLOOKUP
- Pivot tables
- Charts
Your goal is not to become an Excel wizard.
Your goal is to feel comfortable exploring and summarizing data fast.
This stage gives you confidence. It also teaches you how to think in rows, columns, categories, and metrics.
Step 3: Learn SQL deeply
SQL is one of the most important skills for a data analyst.
If you are serious about data analytics, SQL is not optional.
Most entry-level data analyst interviews include SQL questions. Most analyst jobs use SQL to query data from databases.
Start with the basics:
- SELECT
- WHERE
- ORDER BY
- LIMIT
- DISTINCT
Then move to:
- AND and OR
- CASE WHEN
- GROUP BY
- HAVING
- COUNT, SUM, AVG, MIN, MAX
Then go deeper:
- INNER JOIN
- LEFT JOIN
- RIGHT JOIN
- Subqueries
- CTEs
- Window functions
Do not just watch lessons. Write queries every day.
Use practice platforms or real datasets.
Your goal is to answer business questions, not just memorize syntax.
For example:
- Top 10 customers by revenue
- Monthly sales by region
- Users who signed up but never purchased
- Products with the highest return rate
Step 4: Learn data cleaning
Real-world data is messy.
It has missing values, wrong formats, duplicates, typos, and broken categories.
A big part of analytics is cleaning data before analysis.
You should learn how to:
- Remove duplicates
- Fix blank values
- Standardize date formats
- Clean currency and text fields
- Split and merge columns
- Identify outliers
- Validate consistency
You can practice this in Excel, Google Sheets, SQL, or Python later.
The important thing is to build the habit of checking data quality before trusting the output.
Step 5: Learn basic statistics
You do not need advanced math to become a data analyst.
But you do need basic statistics.
Focus on these topics:
- Mean
- Median
- Mode
- Range
- Standard deviation
- Percentage change
- Correlation
- Distribution
- Sample vs population
- Basic probability
Then learn practical concepts like trends, seasonality, outliers, comparison across time, and significance in simple experiments.
You just need enough to avoid making weak conclusions.
Step 6: Learn data visualization
Analysis is only useful if people can understand it.
You need to know how to present findings clearly.
Start with chart basics:
- Bar charts
- Line charts
- Scatter plots
- Tables with highlights
- KPI cards
Then learn dashboard thinking:
- One dashboard should answer one business goal
- Do not overload charts
- Show trends clearly
- Use filters only where needed
- Keep labels simple
You can start with Excel charts, then move to Power BI or Tableau.
Pick one BI tool first. Do not learn both at once in the beginning.
Step 7: Build business thinking
This step separates average analysts from strong analysts.
Many beginners think analytics is about tools. It is not.
You need to understand common business metrics such as:
- Revenue
- Profit
- Conversion rate
- Churn
- Customer acquisition cost
- Retention
- Average order value
- Monthly active users
You should also learn how different teams think:
- Marketing cares about traffic, leads, CAC, ROAS
- Sales cares about pipeline, closed deals, conversion
- Product cares about activation, retention, feature usage
- Operations cares about time, cost, efficiency
- Finance cares about revenue, margin, forecasting
When you analyze data through business context, your work becomes more useful.
Step 8: Learn Python after SQL and spreadsheets
Many beginners start with Python too early. That slows them down.
Python is useful, but it should come after spreadsheets and SQL.
As a data analyst, focus on practical Python:
- Variables
- Lists
- Dictionaries
- Functions
- Pandas
- NumPy basics
- Reading CSV and Excel files
- Data cleaning with pandas
- Grouping and summarizing
- Matplotlib basics
You do not need advanced software engineering. You need practical Python for data tasks.
Step 9: Build projects early
Do not wait until you finish learning.
Start building projects as soon as possible.
A strong beginner portfolio can include:
Project 1: Sales Dashboard
Analyze sales by month, region, category, and profit margin.
Project 2: Customer Churn Analysis
Find patterns behind why customers stop using a service.
Project 3: Marketing Campaign Performance
Compare channels, conversion rates, and return on ad spend.
Project 4: SQL Business Case Study
Write SQL queries to answer real business questions from a public dataset.
Project 5: Operations Efficiency Report
Track delivery times, delays, costs, or service levels.
For each project, show:
- The business question
- The dataset
- The cleaning steps
- The analysis
- The main insights
- Your recommendations
Step 10: Build a simple portfolio
Your portfolio does not need to be fancy. It just needs to be clear.
You can use:
- GitHub
- Notion
- A simple personal website
- LinkedIn posts with project screenshots
Each project should include:
- Title
- Short problem statement
- Tools used
- Screenshots
- Key findings
- Link to notebook, SQL file, or dashboard
A certificate says you learned. A portfolio shows you can do.
Step 11: Learn how to communicate insights
Data analysts are not hired only for technical work.
They are hired because they can explain findings clearly.
Practice:
- Writing short summaries
- Explaining charts in plain language
- Turning data into action points
- Speaking about your projects without jargon
Instead of saying retention decreased by 8 percent in cohort two, say users who signed up in February were less likely to return, which suggests an onboarding issue after signup.
That is clearer. That sounds business-ready.
Step 12: Prepare your resume the right way
Do not create a resume that just lists tools.
Instead, show what you built and what you found.
Weak example:
- SQL
- Excel
- Tableau
- Python
Better example:
- Built a Power BI dashboard to analyze monthly sales trends across four product categories
- Wrote SQL queries to identify top customers and low-performing regions
- Cleaned and analyzed customer churn data using Python and pandas
Step 13: Practice interview questions
Start interview prep before you feel fully ready.
Focus on:
- SQL practice
- Spreadsheet questions
- Dashboard interpretation
- Business case questions
- Project walkthroughs
Be ready to answer:
- Tell me about one project
- How did you clean the data
- What insight did you find
- Why did you choose that chart
- What would you improve
- What is the difference between INNER JOIN and LEFT JOIN
- How would you calculate monthly growth rate
Step 14: Apply strategically
Do not apply to random jobs with the same resume.
Apply with focus.
Start with:
- Junior data analyst
- Business analyst
- Reporting analyst
- Operations analyst
- Product analyst intern
- Data analyst intern
Tailor your resume slightly for each role.
If the job focuses on dashboards, show dashboard work. If it focuses on SQL, show SQL case studies. If it focuses on marketing data, show campaign analysis.
Step 15: Keep upgrading after you land the role
Your first data analyst job is not the end. It is the start.
Once inside, keep building:
- Stronger SQL
- Better dashboards
- Python automation
- Business understanding
- Stakeholder communication
Later, you can move into:
- Senior data analyst
- Product analyst
- Analytics engineer
- Business intelligence analyst
- Data scientist
A practical 4-month roadmap
Month 1
Learn spreadsheets and SQL basics.
Month 2
Go deeper into SQL and start statistics.
Month 3
Learn Power BI or Tableau and build one dashboard project.
Month 4
Learn Python basics for analysis and build two more projects.
At the same time:
- Post your progress
- Document projects
- Prepare your resume
- Apply gradually
Final advice
Do not try to become perfect before you start.
Start small. Stay consistent. Build while learning.
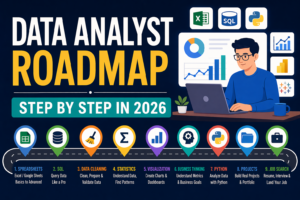
The winning order is simple:
- Spreadsheets
- SQL
- Data cleaning
- Statistics
- Visualization
- Business thinking
- Python
- Projects
- Portfolio
- Applications
If you follow this data analyst roadmap step by step, data analytics becomes much less confusing and much more achievable.


No Comments