


Table Of Contents
Add a header to begin generating the table of contents

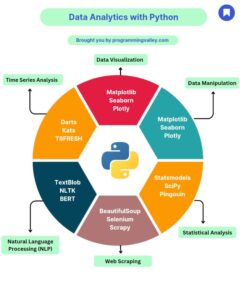
Python powers modern data analytics workflows—from data collection and transformation to visualization and forecasting. Here’s a structured breakdown of the tools you need to know.
Data Visualization
Turn data into charts, dashboards, and stories.
- Matplotlib — Build static and interactive plots
- Seaborn — Simplify statistical graphics like heatmaps and violin plots
- Plotly — Create fully interactive charts and web-based dashboards
Time Series Analysis
Analyze trends, seasonality, and forecasting.
- Darts — Forecast time series using machine learning and deep learning
- Kats — Facebook’s toolkit for anomaly detection and forecasting
- TSFRESH — Extract features automatically from time series datasets
Data Manipulation
Clean and transform raw data into structured formats.
- Pandas — Core library for working with DataFrames, CSVs, and Excel
- NumPy — High-speed operations on arrays and numerical data
- SciPy — Advanced math functions for integration, optimization, and stats
Statistical Analysis
Apply statistical methods to draw meaningful conclusions.
- Statsmodels — Build linear models and conduct hypothesis testing
- SciPy — Analyze distributions, correlation, and signal processing
- Pingouin — Run statistical tests with readable syntax
Natural Language Processing (NLP)
Analyze and process text data.
- TextBlob — Simplify sentiment analysis and POS tagging
- NLTK — Full-featured toolkit for NLP tasks and corpora
- BERT — Use transformer models for state-of-the-art text understanding
Web Scraping
Collect data from websites for analysis.
- BeautifulSoup — Parse HTML and XML documents with ease
- Selenium — Automate browsers to scrape dynamic content
- Scrapy — Build scalable web crawlers with built-in pipeline support
Ready to build your analytics workflow with Python?
Start learning for free at programmingvalley.com


No Comments