


Add a header to begin generating the table of contents
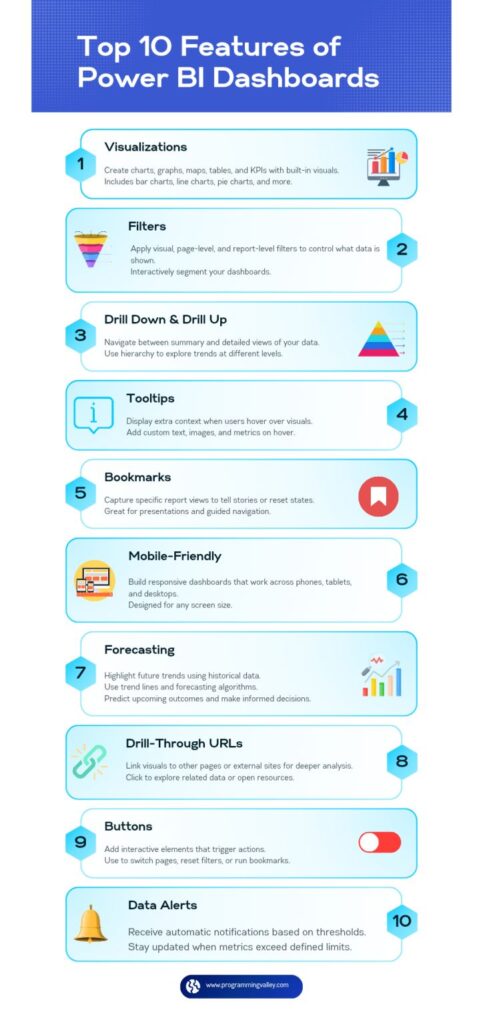
Power BI helps you turn raw data into interactive dashboards and business insights. But to get the most out of it, you need more than just charts. These ten features will level up your reporting game.
1. Visualizations
Use built-in visuals to create charts, graphs, maps, KPIs, and more.
Choose the right format to make insights clear and engaging.
2. Filters
Apply slicers, visual filters, and page-level filters to focus on what matters.
Let users explore data dynamically with ease.
3. Drill Down & Up
Allow users to click through levels of data—like from year to month to day.
Perfect for analyzing trends within data hierarchies.
4. Tooltips
Add extra insights when users hover over visuals.
Show context, comparison data, or supplementary metrics instantly.
5. Bookmarks
Save specific views and create interactive report navigation.
Useful for presentations and guided storytelling.
6. Mobile Friendly
Design dashboards that look good and work well on phones and tablets.
Preview layouts to ensure a smooth mobile experience.
7. Forecasting
Use built-in algorithms to predict future trends based on historical data.
Great for sales, demand, or performance projections.
8. Drill-Through URLs
Link to other report pages or even external sites for deeper analysis.
Create a seamless multi-page report experience.
9. Buttons
Add clickable buttons for navigation, resetting filters, or triggering actions.
Makes your reports feel more like interactive applications.
10. Data Alerts
Set alerts for KPIs—get notified when values cross set thresholds.
Stay ahead of the numbers in real time.


No Comments