


When it comes to data visualization and business intelligence tools, Tableau and Power BI dominate the field. But if you’re just getting started — which one should you learn?
Let’s break them down by features, strengths, and use cases to help you decide.
📊 1. Overview
| Feature | Tableau | Power BI |
|---|---|---|
| Developed by | Salesforce | Microsoft |
| Launch Year | 2003 | 2015 |
| Primary Use | Data Visualization | BI + Microsoft Ecosystem |
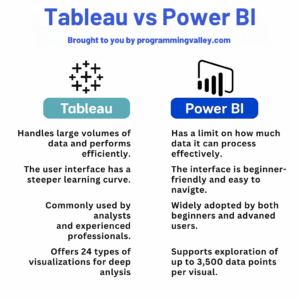
Tableau is known for its stunning visuals. Power BI excels in deep integration with Microsoft services like Excel, Azure, and SQL Server.
🧠 2. Learning Curve
- Tableau: Intuitive drag-and-drop but requires understanding of data structure.
- Power BI: Easier for Excel users; uses similar formulas (DAX).
✅ Beginner Tip: Power BI might feel more familiar if you’ve used Excel extensively.
💰 3. Pricing
| Tool | Free Version? | Pro Pricing |
|---|---|---|
| Tableau | Public only | ~$70/user/month |
| Power BI | Yes (Desktop) | ~$10/user/month (Pro) |
✅ For cost-effectiveness, Power BI wins — especially for individual learners and startups.
🧩 4. Integration & Ecosystem
- Power BI integrates seamlessly with:
- Excel
- Azure
- Microsoft SQL Server
- Tableau integrates well with:
- Salesforce
- Google Analytics
- BigQuery
✅ Choose Power BI if you work with Microsoft tools.
✅ Choose Tableau if you’re in marketing, sales, or SaaS companies.
⚙️ 5. Customization & Scripting
- Tableau: Supports Python (TabPy), R, and JavaScript APIs
- Power BI: Uses DAX, Power Query (M), and R/Python integration
✅ Tableau offers more advanced chart flexibility
✅ Power BI is more formula-driven and Excel-like
🧪 6. Performance
- Power BI is optimized for Microsoft infrastructure
- Tableau generally performs better with very large datasets
✅ Both are scalable, but Tableau can handle bigger data with better responsiveness
🎯 7. Career Perspective
| Tool | Popular In | Roles Best Suited |
|---|---|---|
| Tableau | Enterprises, marketing, SaaS | Data Analyst, BI Developer |
| Power BI | Corporates, finance, education | Business Analyst, BI Pro |
✅ Pro Tip: Learning both adds flexibility to your resume.
🧭 Final Verdict
- Learn Power BI if:
- You work in a Microsoft-heavy environment
- You want a lower-cost entry point
- You’re comfortable with Excel
- Learn Tableau if:
- You’re focusing on visual storytelling
- You’re entering SaaS, tech marketing, or enterprise roles
- You want broader integrations beyond Microsoft
📚 Learn BI & Data Visualization
🔗 IBM Data Science Professional Certificate
🔗 SQL Basics for Data Science
🔗 Microsoft Business Analyst Professional Certificate
🔗 Google Business Intelligence Certificate
📘 For more learning guides and visual cheatsheets, explore:
www.programmingvalley.com


No Comments