


The demand for data analysts keeps rising. Businesses rely on data-driven decisions. Every company wants people who can collect, clean, and interpret data fast. If you want to become a data analyst, you need a clear, structured path.
Here’s a complete roadmap that will guide you from beginner to job-ready professional.
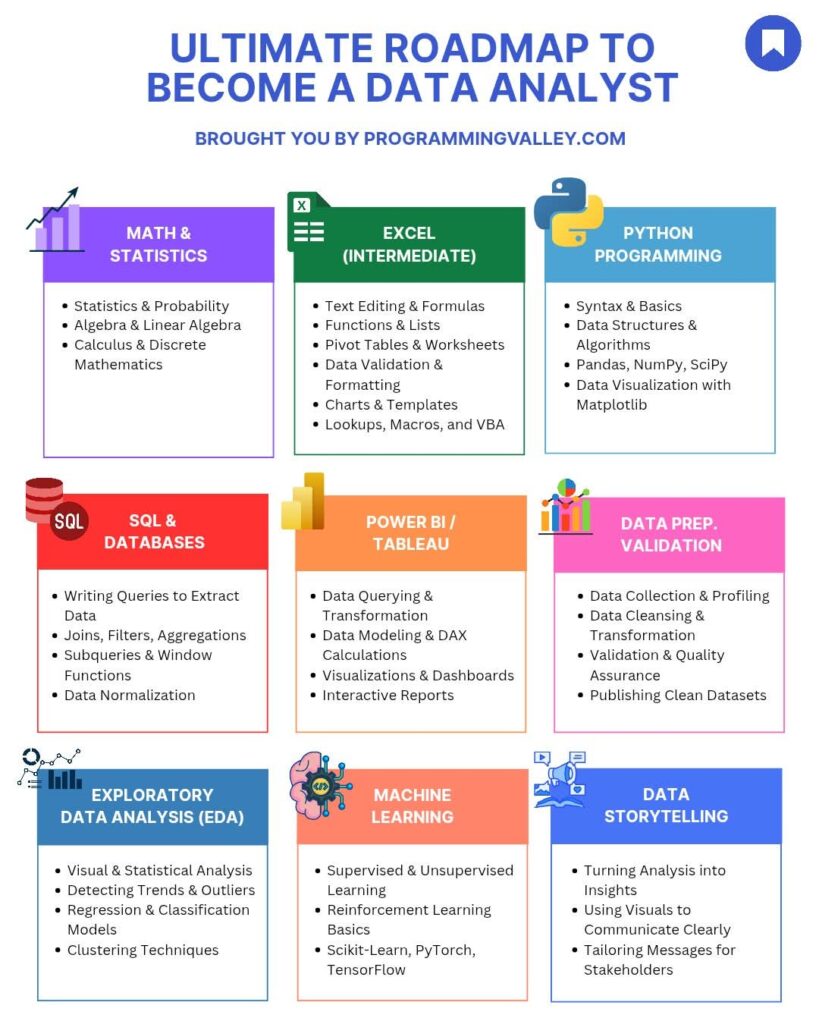
1. Math and Statistics
Start here.
Math and statistics form the foundation of data analysis. You will not succeed without understanding these.
Focus on:
- Statistics and Probability – Learn how data behaves. Study mean, median, mode, variance, and probability distributions.
- Algebra and Linear Algebra – Understand relationships between variables. Learn about equations, matrices, and vectors.
- Calculus and Discrete Mathematics – Grasp optimization and functions. These help when working with algorithms later.
Example: when you calculate the correlation between sales and advertising spend, you use basic statistics.
Your math knowledge helps you find trends and predict outcomes.
2. Excel (Intermediate Level)
Excel is your first data tool. It’s simple but powerful.
You’ll use Excel to organize, manipulate, and visualize data.
Learn to:
- Edit text and create formulas
- Use functions and lists
- Build pivot tables and worksheets
- Apply data validation and formatting
- Design charts and templates
- Automate repetitive work with VBA macros
Example: if you manage retail data, use Excel pivot tables to summarize monthly sales by region.
Excel helps you understand core data concepts before moving to advanced tools.
3. Python Programming
Once you master Excel, move to Python.
Python is the most used programming language in data analysis. It’s flexible, powerful, and supported by many libraries.
Learn:
- Syntax and basics
- Data structures and algorithms
- Libraries like Pandas, NumPy, and SciPy
- Visualization tools such as Matplotlib and Seaborn
Example: use Pandas to clean a large dataset in seconds instead of doing it manually in Excel.
Python also prepares you for machine learning and automation.
4. SQL and Databases
Every analyst must know SQL.
SQL (Structured Query Language) allows you to talk to databases. You’ll use it daily to extract, filter, and combine data.
Master these areas:
- Writing queries to extract data
- Joins, filters, and aggregations
- Subqueries and window functions
- Data normalization
Example: if you need to pull customer orders from multiple tables, SQL joins make it fast and clean.
SQL gives you direct access to real-world company data.
5. Power BI and Tableau
After cleaning and preparing data, you need to visualize it.
Power BI and Tableau are the top tools for dashboards and reports.
Focus on:
- Data querying and transformation
- Data modeling and DAX calculations
- Creating dashboards
- Building interactive reports
Example: a business dashboard showing daily sales, top products, and profit margins helps managers make faster decisions.
Visualization skills make your work visible and useful to others.
6. Data Preparation and Validation
Before analyzing data, you must ensure it’s clean.
Data preparation takes time but improves accuracy.
Key tasks:
- Data collection and profiling
- Data cleansing and transformation
- Validation and quality assurance
- Publishing clean datasets
Example: removing duplicate records before analyzing customer trends.
Clean data builds trust in your analysis.
7. Exploratory Data Analysis (EDA)
EDA helps you understand data patterns.
You explore datasets visually and statistically to uncover insights.
Learn:
- Visual and statistical analysis
- Detecting trends and outliers
- Regression and classification models
- Clustering techniques
Example: detecting which products sell more during specific seasons using regression.
EDA is where analysis becomes insight.
8. Machine Learning Basics
Once you’re comfortable with EDA, move to machine learning.
You’ll use it to predict future outcomes or classify data.
Learn:
- Supervised and unsupervised learning
- Reinforcement learning basics
- Libraries like Scikit-Learn, PyTorch, and TensorFlow
Example: predicting customer churn based on historical behavior.
Machine learning adds advanced capability to your analyst profile.
9. Data Storytelling
Data analysis is useless if people can’t understand it.
You must learn to communicate your findings clearly.
Practice:
- Turning analysis into insights
- Using visuals to explain results
- Tailoring messages for stakeholders
Example: instead of showing raw charts, explain what the data means for business growth.
Storytelling turns complex data into decisions.
Building Your Data Analyst Portfolio
As you progress, build a portfolio.
Include projects such as:
- Excel dashboards
- SQL data queries
- Python EDA reports
- Tableau visualizations
- Machine learning models
Show real-world results. Recruiters value examples of applied skills.
Practical Tips
- Practice daily with real datasets from Kaggle or Google Dataset Search.
- Join online communities and contribute to discussions.
- Stay updated with new libraries and tools.
- Learn version control using GitHub.
- Track your progress weekly.
Final Thoughts
Becoming a data analyst is not about learning everything at once.
Follow a structured path:
- Build strong math and stats knowledge
- Master Excel and SQL
- Learn Python
- Create dashboards in Power BI or Tableau
- Practice EDA and machine learning
- Communicate insights through storytelling
You’ll move from raw data to real business value.
Every skill you learn compounds.
If you stay consistent, within 6 to 12 months you can reach a professional level.
What’s your next step today?


No Comments